
SMG - Case Management
Role: UX Product Designer
SMG is a customer experience platform primary in the retail market. Case Management is a piece of the platform that deals with ongoing customer
Objectives
The main objectives are allowing users to select on a row to open details about a specific “case” or row in this case and the ability to export the data within the table into a flat file (ex. Excel document). Data tables for many clients will have large amounts and many different categories of data therefore, organization and flexibility of large amounts of data is the biggest challenge. Compiling and nesting existing and new components while integrating multiple interactions into an intuitive solution goes along with that. Presenting information that users are used to seeing and need to see initially and hiding other information that is less relevant. This is a very flexible and complex visual to design. A large amount of users from different departments use this tool so I will have to make it work as a very standard and simple product.
Notes for Developers
This is a complex component to build so I made an annotated art board in Figma for better clarity of functionality when developers enter the file to develop this page to prevent errors and unnecessary future iterations.
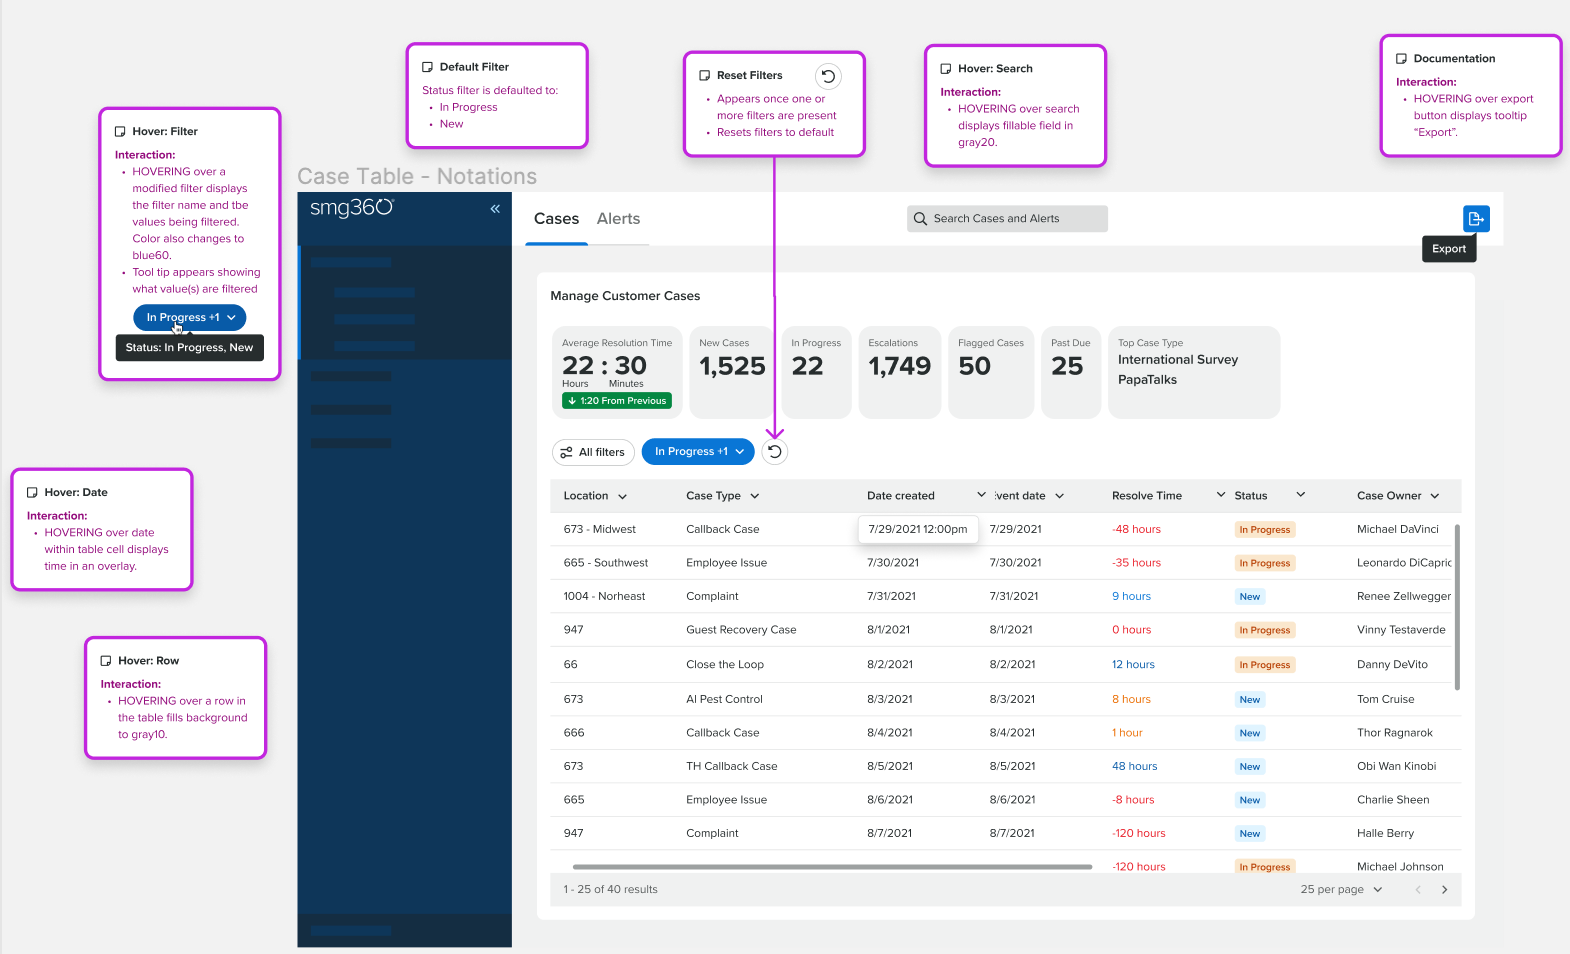
Top Metrics
These top metrics are shown along the top of the page below the navigation and are essentially small cards that aren’t interactive. Their purpose are to show key information based on the data within the table. These metrics are configured by admin users during initial setup process.
Time metric with badge showing sentiment (green=positive, red=negative) based on direction of change from the last period.
6 metrics max
extreme situations
When designing for large amounts of users and data it’s important to understand the extremely rare situations. The amount of columns shown in this data table are configured by admin users during the initial setup process. The left image shows all possible columns users could configure as oppose to the absolute minimal amount shown on the right.
All possible columns
Least possible columns
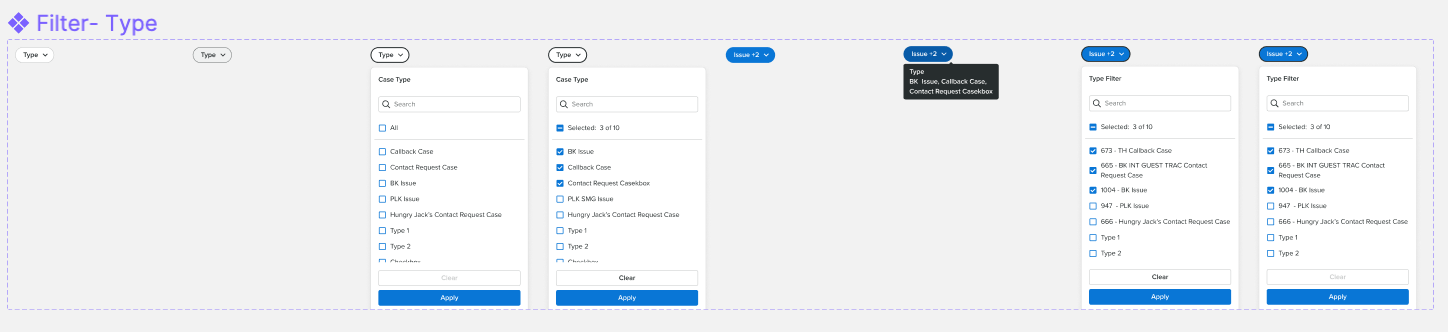
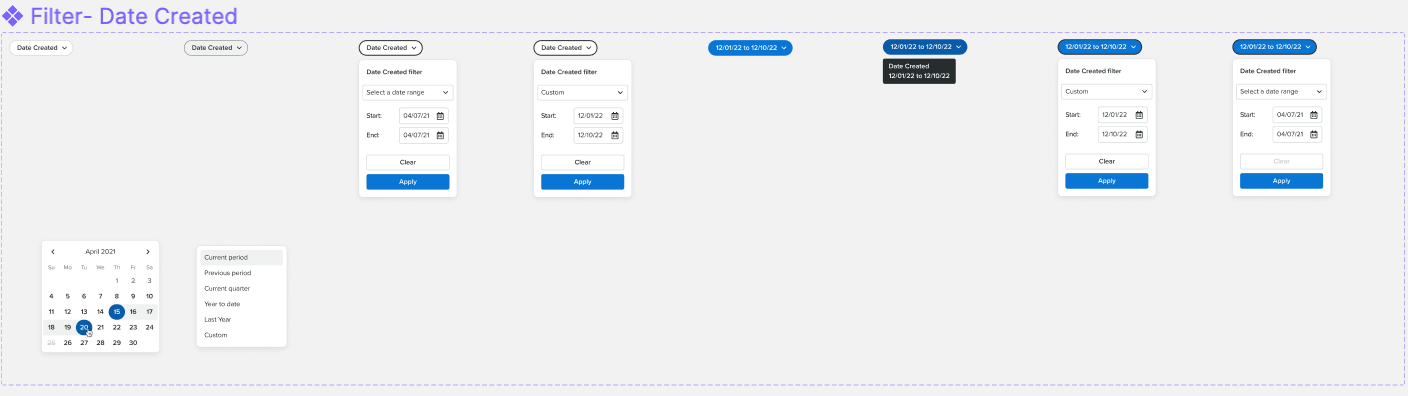
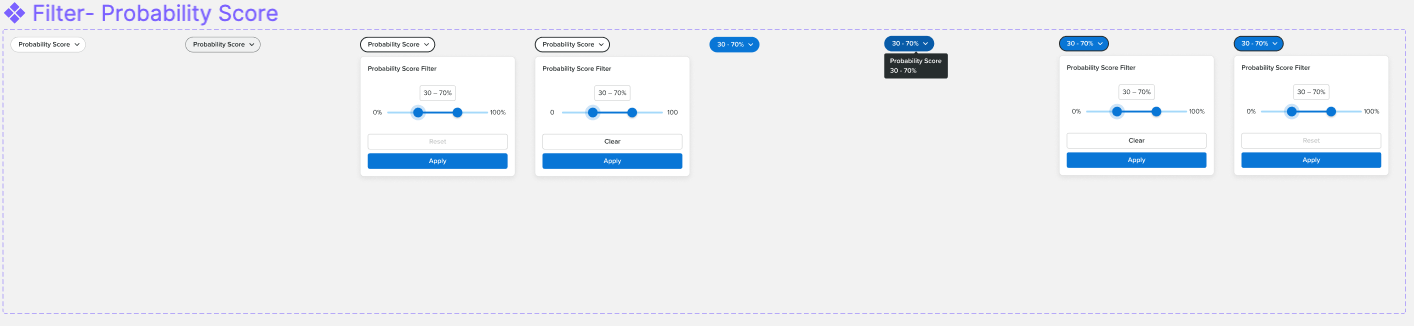
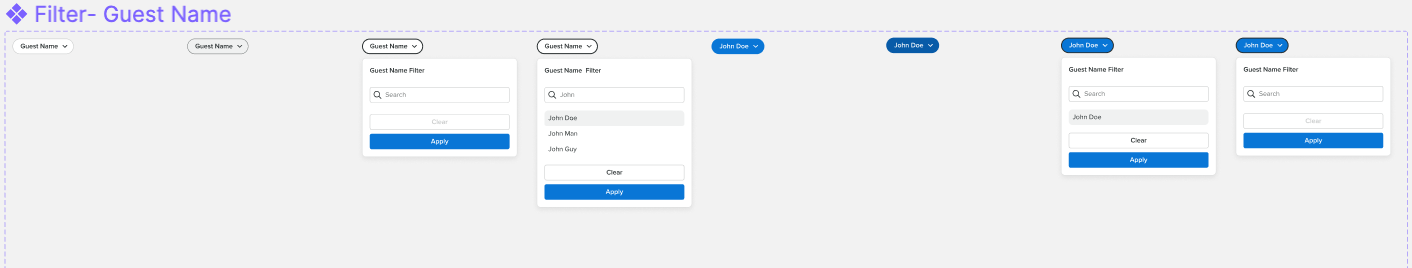
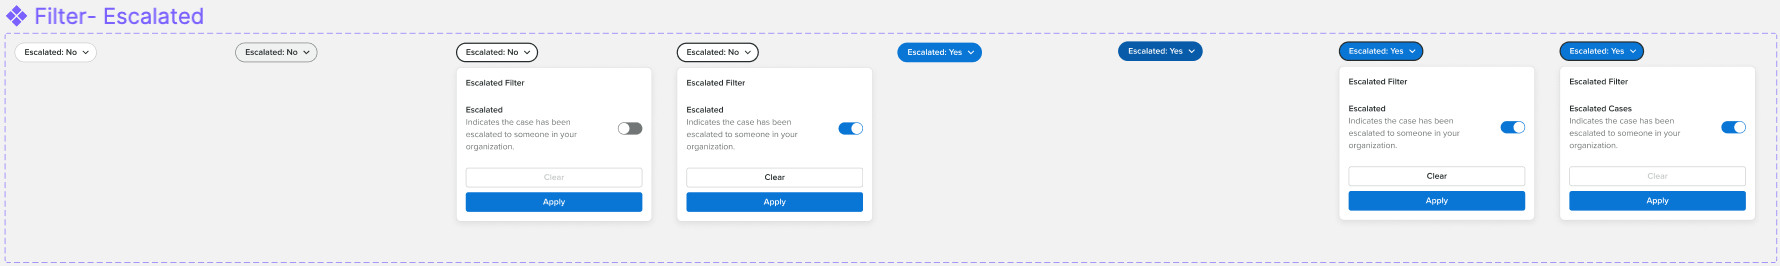
Filters
Filters are used to granulize the information in view. Filters are widely used in many different digital products and are very crucial when using a data table. Below are different filter types that I designed for this data table based on the information I was given.
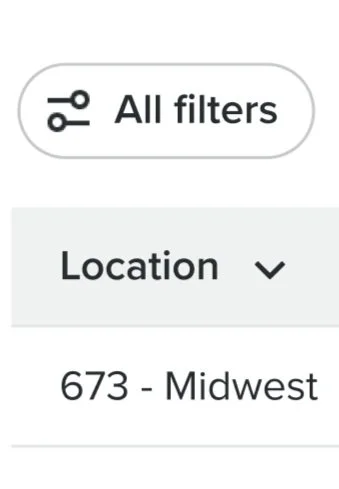
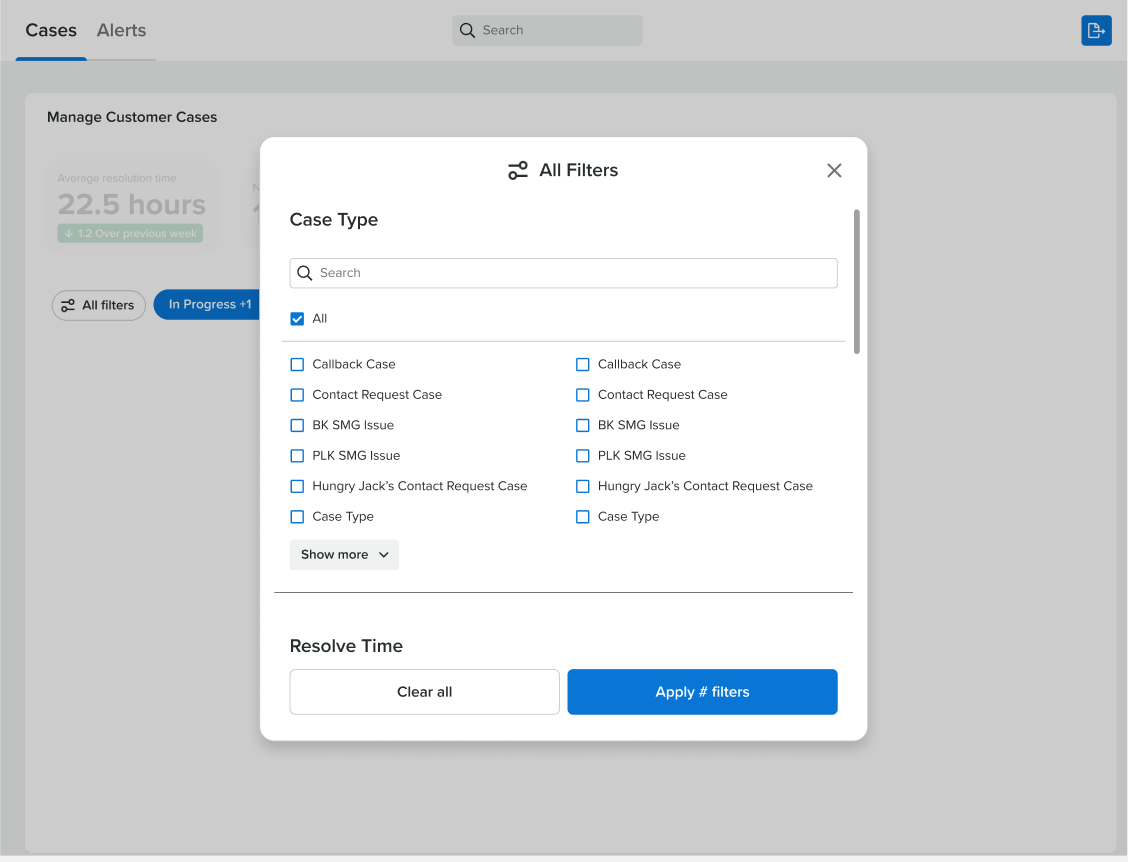
All Filters Modal
The all filters button opens a filter modal or pop-up that reveals all possible filters. Users can select filters within this modal and apply them directly to the case table. Each filter category that has been applied will individually display filter buttons along the top of the data table that can be edited.
Hover
There are six different hover interactions within this data table that I have highlighted for accurate development.